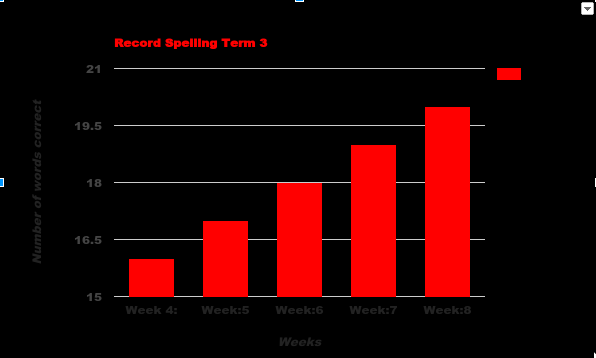
The data in this graph shows that this student in the first week had a score of 16 then the following week made progress to 17. At week 8 he scored 20 which shows that there is improvement that is consistent.
WALHT;
- Use a spreadsheet to enter and display data.
- Analyse and discuss data display.
I like the way you analysed your data and put it in a short synopsis of what the graphs show.
ReplyDeleteThis comment has been removed by the author.
ReplyDeleteGreat application and analysis of your displayed data. Keep it up!
ReplyDelete